See what needs you today, how your community is growing, and what to work on next.
Only Community Admins can open Dashboard and Analytics. Moderators, Course Managers and Blog Managers don't see them.
The Dashboard
In Studio, click Dashboard. It is the first page you see when you open Studio.
At the top, pick Last 7 days, Last 30 days or Last 90 days. The Dashboard opens on 7 days.
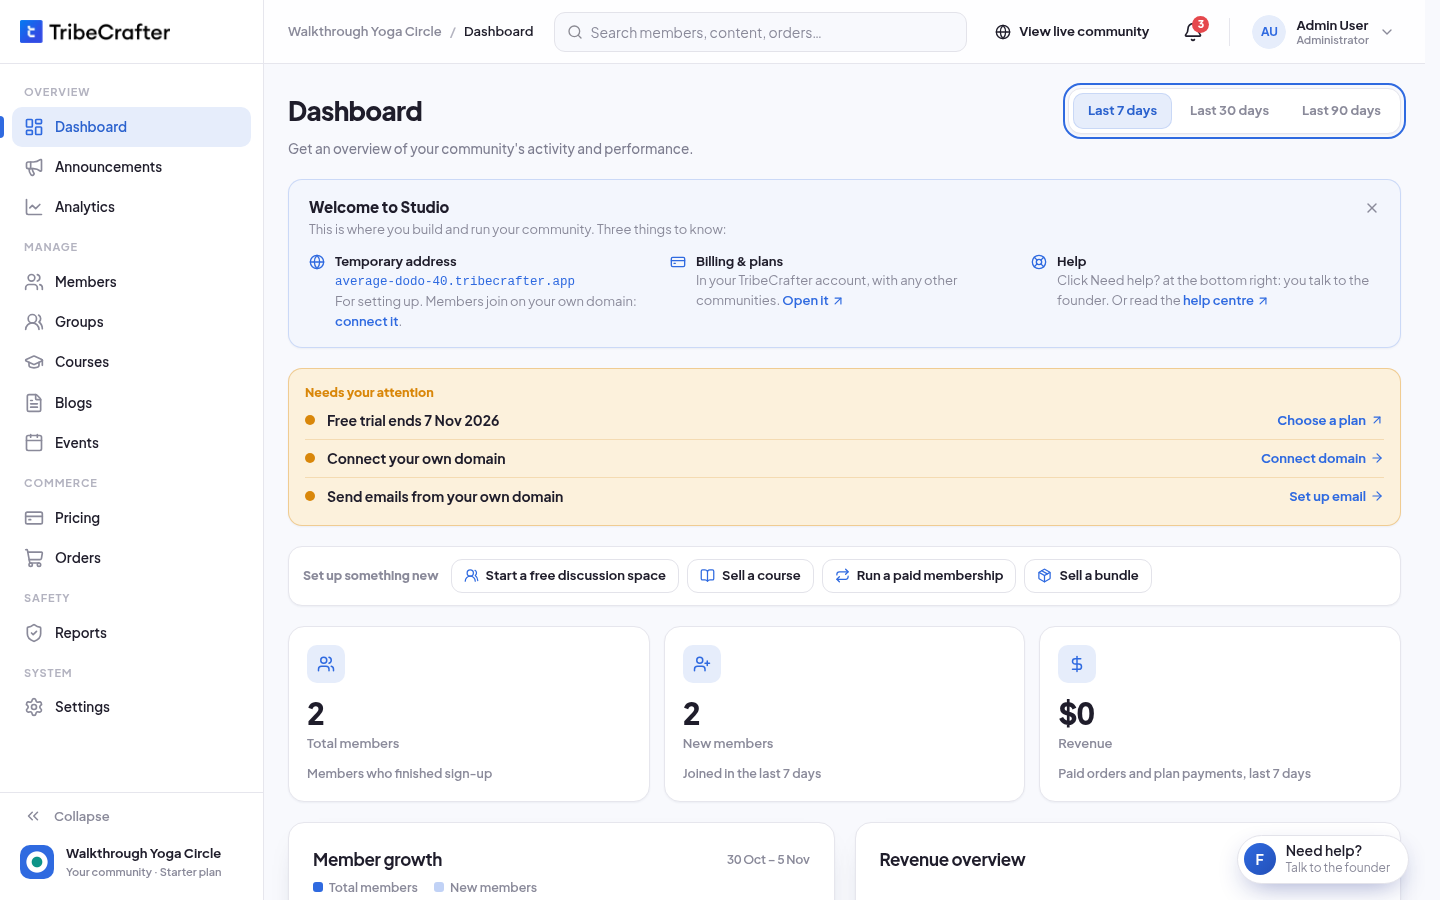
From top to bottom you see:
| Part | What it shows |
|---|---|
| Welcome to Studio | Your community address, where billing lives, and how to get help. Close it with the X. It stays closed in this browser. |
| Needs your attention | Things to fix, each with a link. See below. |
| Before you go live | The 6 go-live checks, until they are all done. See Your go-live checklist. |
| Set up something new | Goals such as Start a free discussion space or Sell a course. Each one shows the steps and opens the right screens. |
| Total members | Members who finished sign-up. |
| New members | Members who joined in the period you picked. |
| Revenue | Paid orders and plan payments in that period. |
| Member growth and Revenue overview | Charts for each day. Days run midnight to midnight UTC. |
| Recent members, Community activity, Recent orders | The newest ones. Click View all to see the full list. |
While go-live checks are still open, the Dashboard shows the Welcome card, Needs your attention and the checklist only. The date switch, numbers and charts appear when the community is live.
With no members yet, the Dashboard shows "What do you want to set up first?" and Finish the basics: invite members, edit your landing page, and write your first blog post.
The charts update every hour. A new community sees "Your charts are on their way" until the first numbers come in.
Community activity
On the Dashboard, under Community activity, click View all. You see what happened, newest first: new members, posts, comments, enrollments, event sign-ups, purchases and new content. Use the tabs to see one kind. Click a name to open that member, course, group or order.
Needs your attention
The bell at the top of every Studio page shows the same items as the yellow box on the Dashboard. The red number is how many there are.
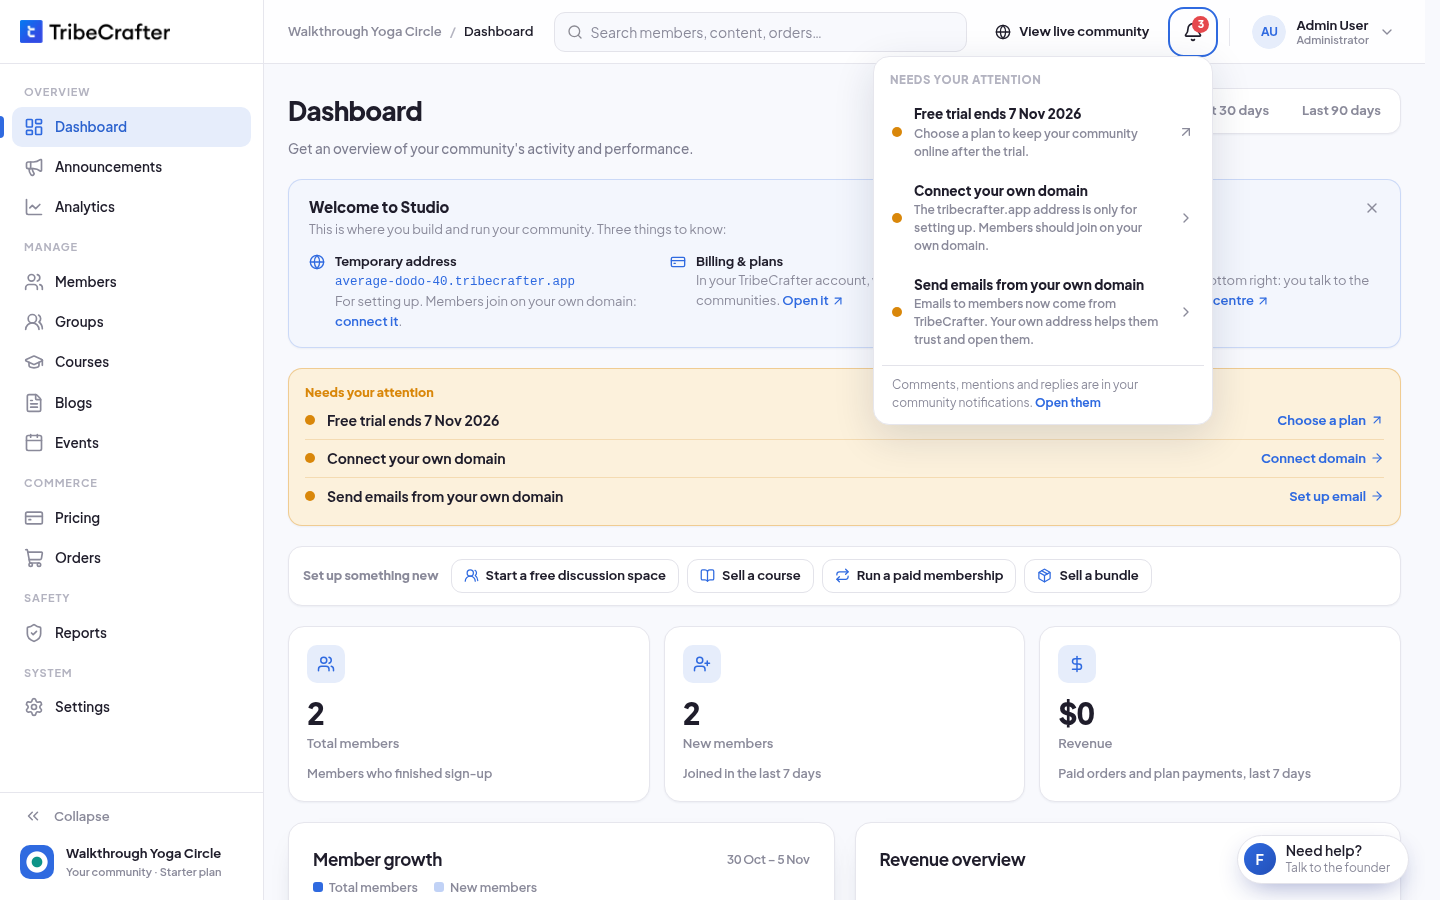
| Item | Click | Who can fix it |
|---|---|---|
| "Your last payment failed" | Update card | The owner |
| "Free trial ends" or "Your plan ends" | Choose a plan or Keep my plan | The owner |
| "N reports to review" | Review | Admins and Moderators |
| A course "needs a plan or product" | Open course | Admins |
| "Stripe needs more details" | Add details | The person who connected Stripe |
| "Email sending is not verified" | Check DNS | The owner |
| "Connect your own domain" | Connect domain | The owner |
| "Send emails from your own domain" | Set up email | The owner |
| Storage or team seats almost full | Upgrade plan | The owner |
Other admins see the owner's items with a note to ask the owner, for example "Only the community owner can set this up. Let them know."
When nothing needs you, the menu says "Nothing needs you right now."
Comments, mentions and replies to you are not here. They are in your notifications in the community: click Open them at the bottom of the menu.
Analytics
In Studio, click Analytics. Numbers update every hour.
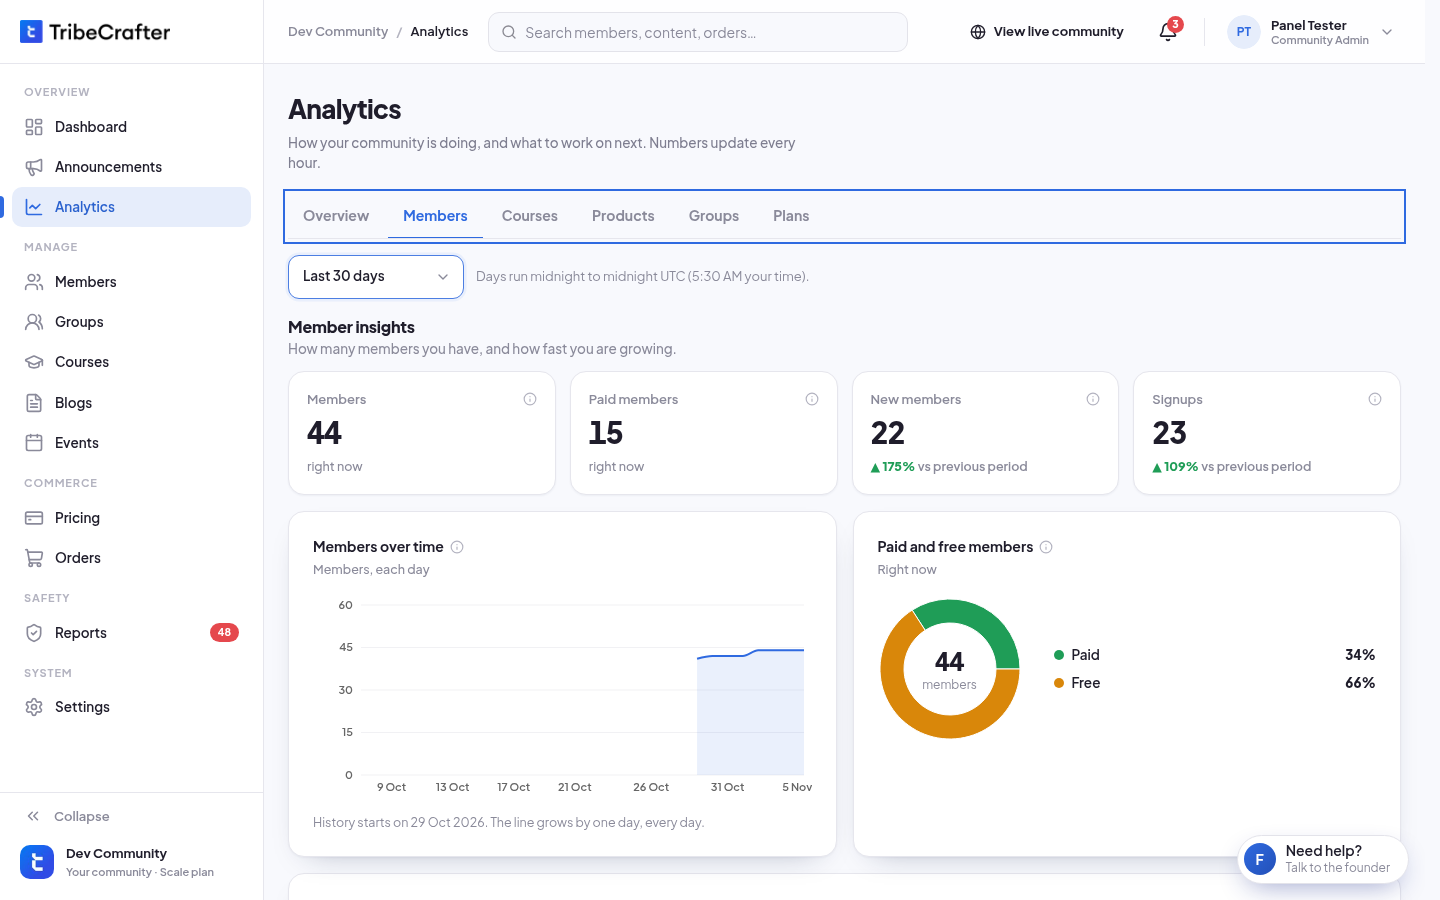
The page has 6 tabs:
| Tab | What you see |
|---|---|
| Overview | Your weekly coach. See below. |
| Members | Members and Paid members right now, New members and Signups in the period, with charts. |
| Courses | Enrolled, Completed, Average progress, New enrollments, Certificates, and a table for each course. Pick All courses or one course. |
| Products | Sales and Revenue, the share of each product, and Sales by product. |
| Groups | Members, Engaged, New members, Posts and Comments, and a table for each group. Pick All groups or one group. |
| Plans | Active subscribers, MRR, New subscriptions, Ended subscriptions, and a table for each plan. |
On every tab except Overview, pick Last 7 days, Last 30 days, Last 90 days or Last 12 months. Analytics opens on 30 days.
Each number shows "right now" or the change from the period before, for example "▲ 175% vs previous period". Click the ⓘ next to a number to see what it counts.
A new chart shows "History starts on . The line grows by one day, every day."
Why the member numbers differ
The Members number in Analytics counts only active members who finished signing up. People who haven't finished onboarding or verified their email, and suspended members, are not counted. So the Members page in Studio can show more people.
The Overview tab (weekly coach)
The Overview tab looks at whole weeks, Monday to Sunday (UTC). It tells you if your community is growing, holding steady or shrinking, and which number to fix first.
- Once 50 members are active in a week, Fix first shows the measure that needs the most work. Click What to try for ideas. From then on, each measure is rated Needs work, Okay or Good.
- The main number is Active members this week. A member is active if they posted, commented, reacted, joined a group, took a lesson, signed up for an event, voted or sent a message.
- The measures are grouped in Join, Stay and Come back. Once you sell something, a Money part shows how free members become paying members.
- Click any number to open its lesson: why it matters and what to try.
A new community sees "Your weekly numbers are on their way" until it has one full week of activity.